All posts by Rachael Browning

See TICOR™ At ADIPEC Abu Dhabi

TICOR will be attending ADIPEC 2015

What is TICOR?

TICOR™ reporting software is used by predictive maintenance and condition monitoring teams for a variety of industry applications to effectively monitor the health and performance of assets.

The android based software has been designed to create instant onsite reports immediately after completion of a inspection.

The software has been developed with a sequence of mathematical, Thermal indexing and load correction formulas to identify minor, important, serious and critical faults within assets.

A sequence of preformatted knowledge based library’s questions are built into the software to enable quick, easy and reliable reporting.

Continue reading See TICOR™ At ADIPEC Abu Dhabi

Condition Monitoring Substations Using TICOR

Condition Monitoring Substations Using TICOR

Condition monitoring  can improve the reliability and and health of electrical substations.

Electric power utilities are faced with an aging infrastructure, increasing risk of blackouts and brownouts. A brownout is a drop in voltage in an electrical power supply, so named because it typically causes lights to dim. Utilities also face costly unplanned maintenance and rising costs.

Using TICOR™ which is an advanced on-site field instant reporting software, designed for professional engineers who carry out professional inspections.

Engineers, surveyors and consultants can now easily capture data on-site for a multiple of commonly used inspection types related to substation monitoring.

Utilities are continuously looking for ways to address  issues to improve the reliability of electric power delivery while at the same time reducing costs.

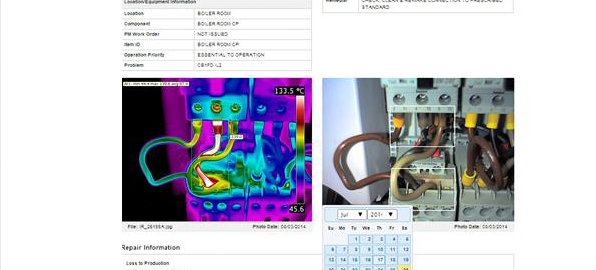
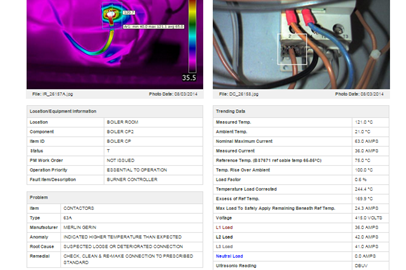
By capturing critical data with TICOR and then uploading reports to WEBCOR utilities can monitor trending patterns and effectively plan remedial works.

Condition monitoring substations TICOR

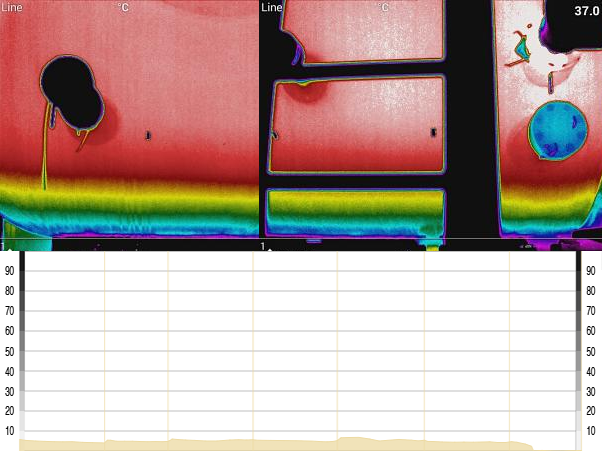
By using thermal imaging and software, failures and security breaches can be detected anytime, day or night, at a remote monitoring location.

Substation components which are prone to fail include:

– Power transformers (oil levels and pump operation)
– Load tap changers (oil levels, other internal problems)
– Insulator bushings (oil levels and bad connections)
– Standoff insulators (moisture, contamination, degradation)
– Lightning arrestors (degradation of metal oxide disks)
– Circuit breakers (oil or SF6 leakage)
– Mechanical disconnects (bad connections, contamination)
– Control cabinets (wear and tear on fans, pumps, and other components)
– Batteries

Contact Us To Discuss Your Project

A Thermal Imaging Engineer’s Day To Day Working Schedule

The Thermographic Engineer 

Inspection workflow for typical consultant company/Engineer

Pack Equipment up:

Fully charged camera and accessories, tools, notepad and pen(cil)

Travel to site:

Drive many miles through heavy traffic or through heavy numbers of city commuters on public transport.

Arrive at site:

Sign in and begin inspection start capturing  images with camera and note down on your notepad item locations, descriptions, ID, temperatures, load ratings and image numbers. Other readings could be taken depending on inspection type. All is recorded onto your pad in scribbled notes or via Bluetooth headset creating a voice note for the image.

Continue reading A Thermal Imaging Engineer’s Day To Day Working Schedule

Tank, Vessel And Process Pipework IR Reporting

Identify – Leakage in pumps, pipes and valves. Insulation breakdown, pipe blockages

This investigation is employing the use of thermographics and infra-red in order to assess the levels of sediment deposits within the process vessels indicated. The object is to provide initial sediment level assessment and to provide baseline thermograms for comparative future inspections so that levels can be monitored and trended accordingly. The baseline thermograms can then be used as a reference point against subsequent images from periodic inspections. This will allow the sediment levels to be monitored along with specific temperature readings of the vessels.

Continue reading Tank, Vessel And Process Pipework IR Reporting

Why Use Thermography Reporting In Condition Monitoring

The principle of thermography is temperature profiling of a surface or point. Every object emits certain amount of IR energy and the intensity of this IR radiation is a function of temperature.

In an electromagnetic spectrum the IR region appears between 0.8 micron to 1000 micron wavelength The IR energy
which can directly represent the surface temperature can be detected and quantified by the help of IR scanning system.

Continue reading Why Use Thermography Reporting In Condition Monitoring

Ticor Fast Track Solution Condition Monitoring Reporting

TICOR Reporting Software

What is TICOR?

TICOR™ reporting software is used by predictive maintenance and condition monitoring teams for a variety of industry applications to effectively monitor the health and performance of assets.

The android based software has been designed to create instant onsite reports in less than 20 seconds after completion of inspection.

TICOR includes a variety of thermographic and visual inspection modules to effectively determine problem areas onsite.

The software has been developed with a sequence of mathematical, Thermal indexing and load correction formulas to identify minor, important, serious and critical faults within assets.

A sequence of preformatted knowledge based library’s questions are built into the software to enable quick, easy and reliable reporting.

Continue reading Ticor Fast Track Solution Condition Monitoring Reporting

TICOR Thermography Software Follows BS7671 British Standard

TICOR refers to the following standards to determine the good or bad condition of an asset when thermography tests are being conducted.

  • Our reference temperature of 75C is arrived at by utilizing BS7671 (British Standard for IET Wiring Regulations). Cable temperatures are recommended to sit between 65-85C at full load. We general utilize 75C however we can adjust the reference accordingly.

Continue reading TICOR Thermography Software Follows BS7671 British Standard

UPS System & Transformer Thermal Imaging Software

Thermal Imaging can easily detect temperature anomalies of electrical or mechanical components that are over heating which commonly indicate a potential problem that requires maintenance.

Using Thermal imaging and TICOR ™ software you can now generate thermal imaging reports onsite for instant fault diagnosis. TICOR™ Reports can then be synced to WEBCOR ™ for online data capture and management of inspections offering unique trending capabilities.

By regularly monitoring equipment and logging and reports via WEBCOR™ you can manage and keep a record of abnormal temperature readings over a period of time. Monitoring changes in trending patters gives you a valuable insight on when maintenance is required.

Continue reading UPS System & Transformer Thermal Imaging Software